

❓Do I have a good network or just a lot of patience?
- Dec 9, 2025
- 2 min read

For this new edition, we will focus on evaluating network quality beyond the initial values collected. We get used to everything, even waiting for a page to load.
Between a temperamental signal, a stuttering videoconference, and a video that is perpetually paused, we end up confusing resilience with patience.
But how can we objectively know if the network is really good... or if we have developed an extraordinary tolerance for slowness?

Between Perceived Quality and Measured Quality
Measured quality is based on objective indicators such as latency, throughput, jitter, or packet loss rate—precise numerical data that is often disconnected from the user experience.
Perceived quality, on the other hand, depends on the actual experience: a smooth video conference, a fast download, or simply the absence of irritation caused by interruptions.
There is a gap between the two that only tools capable of correlating technical measurements and human perception can truly bridge.
From the 3 additional grounded Indicators: Jitter, Packet loss, Drop Rates
Jitter is a duration (ms)
variation in time delay between when a signal is transmitted and received over a network connection, measuring the variability in latency.
In computer networking, jitter can refer to packet delay variation, the variation (statistical dispersion) in the delay of the packets.
Paquet loss as %
= number of lost packets divided by the number of measurements during the time range selected for upload measurements.
Drop Rates
Drops happen when a measure is missing either because the connection failed, or because packets were lost. This drop rate is the number of packet loss divided by the number of measurements during the time range selected.
Building The 4 High level indicators
VOLATILITY , as a %
The volatility is calculated using the maximum and minimum values in the data range.
The common interpretation of volatility is standard deviation of returns.show dispersion of values along a period of time.
STABILITY , as a %
The network stability is computed based on standard deviation, drops, and events.
In statistics, the standard deviation is a measure of the amount of variation of the values of a variable about its mean.
Drops are test failure which could result to packet loss
Event means alarms above threshold
QoE Quality of Experience , scoring from 1 to 5
a value out of 5 signifying the Quality of Experience estimated by using latency, jitter, and packet loss
There are other more accurate metrics for certain types of use. One example is MoS (Mean Opinion Score), which provides a quantified indication of quality after transmission and decompression.
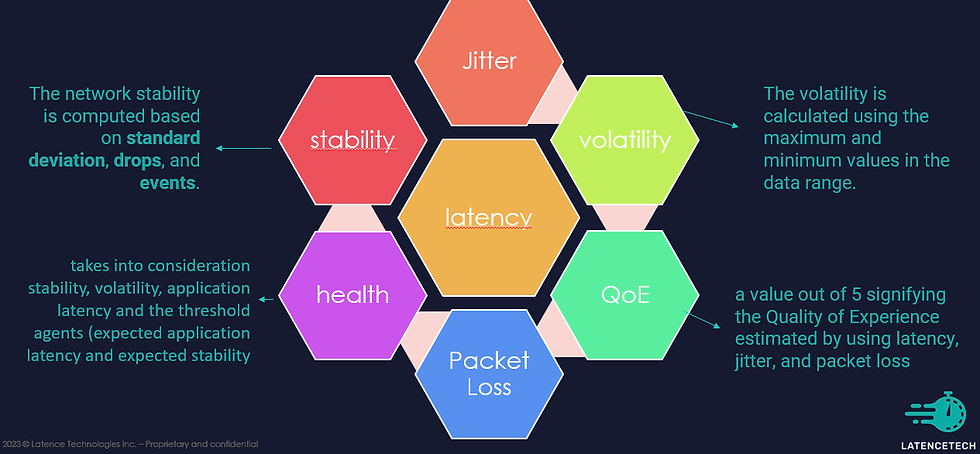
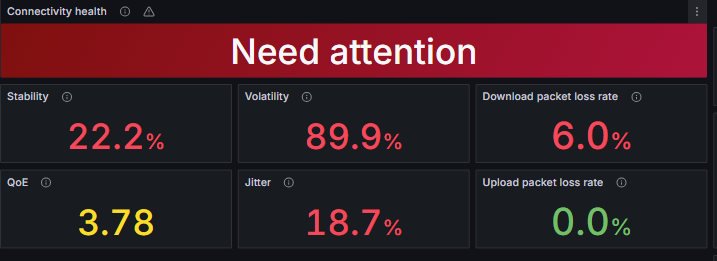
Connectivity Health indicator (CHI)
This high level indicator takes into consideration stability, volatility, application latency and the threshold set in the agents (expected application latency and expected stability that must be defined at launch by user, 30 ms and 95% otherwise).
CHI confidence index is defined by the formula 100 - (10 * SMAPE) where SMAPE is the Symmetric Mean AbsolutE percentage error, an accuracy measure based on percentage (or relative) errors.
Need to know more in SMAPE ?, click here
Conclusion
With these four network indicators, you can get an objective operational overview at a glance.
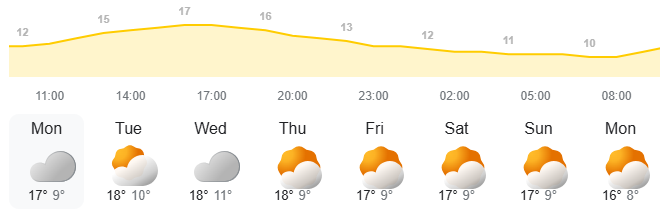
If we add a weather forecast it will be magic.
Marc Soulacroup


Comments